The reporting dashboard provides comprehensive insights into your monitoring performance, including response times, success ratios, and trends across all your checks. Export data for further analysis or create reports for stakeholders.Documentation Index
Fetch the complete documentation index at: https://checkly-422f444a-sync-playwright-reporter-changelog-v1-5-0.mintlify.app/llms.txt
Use this file to discover all available pages before exploring further.
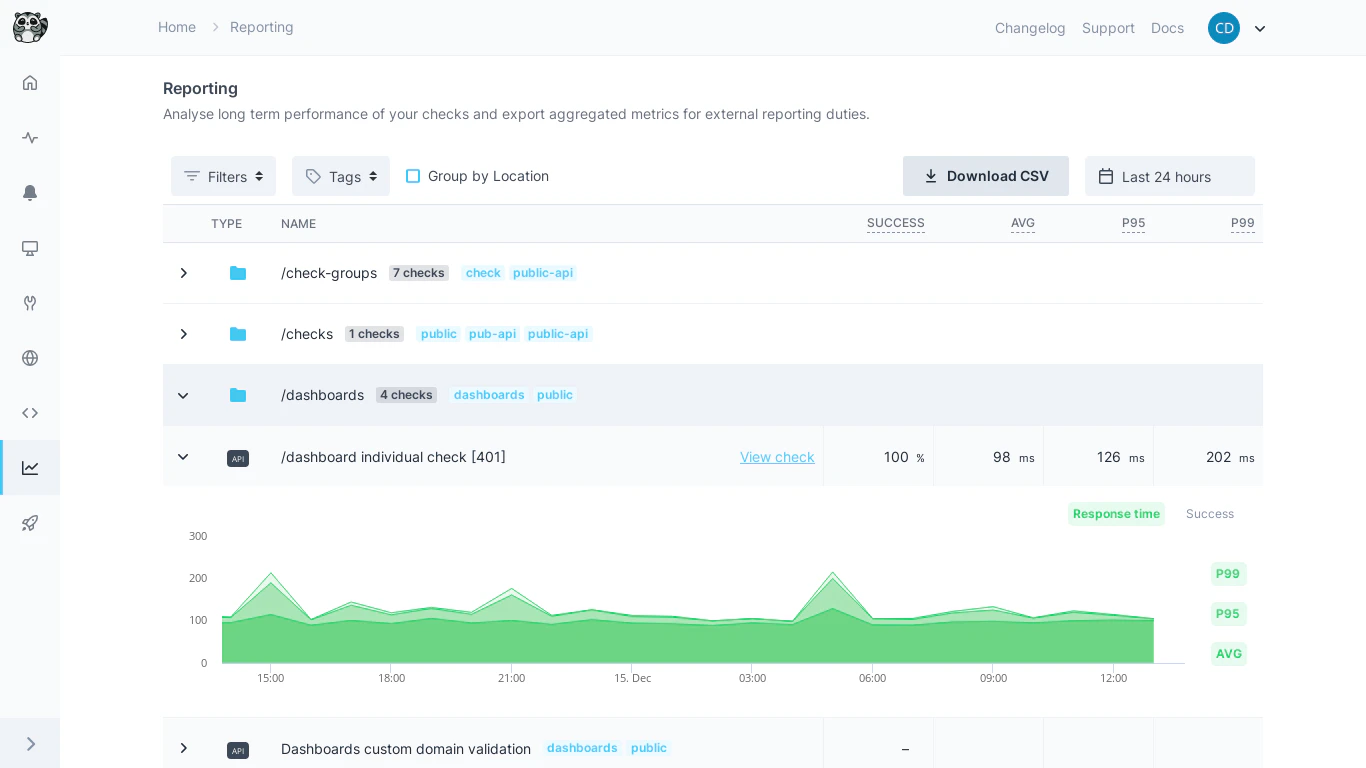
Dashboard Overview
The reporting dashboard displays your first 15 checks with key performance metrics at a glance. Use this view to:- Quickly identify underperforming checks
- Monitor trends across your monitoring infrastructure
- Compare performance between different check types
- Spot patterns in success ratios and response times
Filtering and Sorting
Customize your view using the toolbar filters and sorting options:Date Range
Date Range
Select the time period for your analysis. The dashboard adjusts data granularity automatically based on your selection.
Check Filters
Check Filters
Filter by:
- Check Type: API, Browser, or Multistep checks
- Check Tags: Filter by tags applied to individual checks
- Check Group Tags: Filter by tags applied to check groups
Sorting Options
Sorting Options
Sort your results by:
- Name: Alphabetical order (ASC/DESC)
- Check Type: Group similar check types together (ASC/DESC)
Performance Graphs
Click any check to view detailed performance graphs showing response times and success ratios over your selected time period.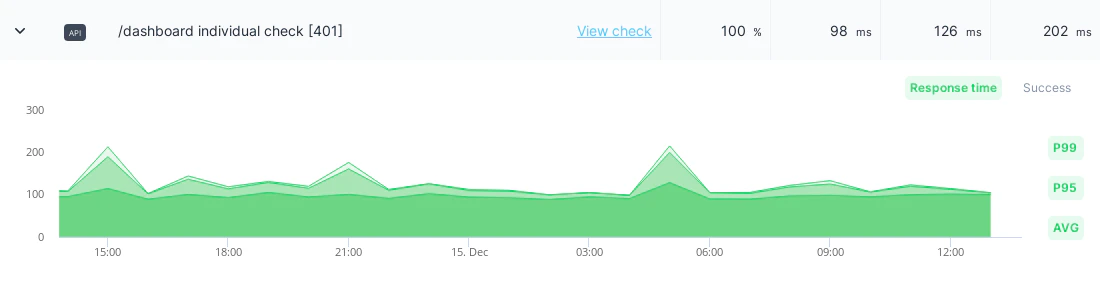
Graph Features
Response Time Metrics: Toggle between average, P95, and P99 response times using the metric pills beside the graph. Success Ratio: Track the percentage of successful check runs over time. Dynamic Granularity: Data grouping adjusts automatically based on your date range:| Date Range | Data Grouping |
|---|---|
| Up to 2 weeks | Hourly |
| Up to 6 months | Daily |
| Up to 24 months | Weekly |
| Up to 48 months | Monthly |
| Beyond 48 months | Yearly |
Data Export
Export your monitoring data for external analysis, reporting, or archival purposes.CSV Export Process
Export Data Fields
The CSV export includes the following columns:| Field | Description |
|---|---|
| Name | Check name for identification |
| Check ID | Unique identifier for the check |
| Check Type | API, Browser, or Multistep |
| Success Ratio | Percentage of successful runs |
| Response Time (Average) | Mean response time |
| Response Time (P95) | 95th percentile response time |
| Response Time (P99) | 99th percentile response time |
| Check Tags | Applied tags for categorization |
All statistics are calculated based on your selected date range. The default range is “Last 24 Hours”.
Best Practices
- Regular exports: Schedule periodic data exports for long-term trend analysis
- Filter strategically: Use tags and groups to create focused reports for different teams
- Monitor P95/P99: Don’t rely only on averages - percentiles reveal user experience reality
- Compare periods: Use date range filtering to compare performance before and after deployments