Dashboards provide a detailed way to communicate the status of your checks and monitors to internal and external audiences. Create professional, branded status displays for customers, internal teams, or specific stakeholders.Documentation Index
Fetch the complete documentation index at: https://checkly-422f444a-sync-playwright-reporter-changelog-v1-5-0.mintlify.app/llms.txt
Use this file to discover all available pages before exploring further.
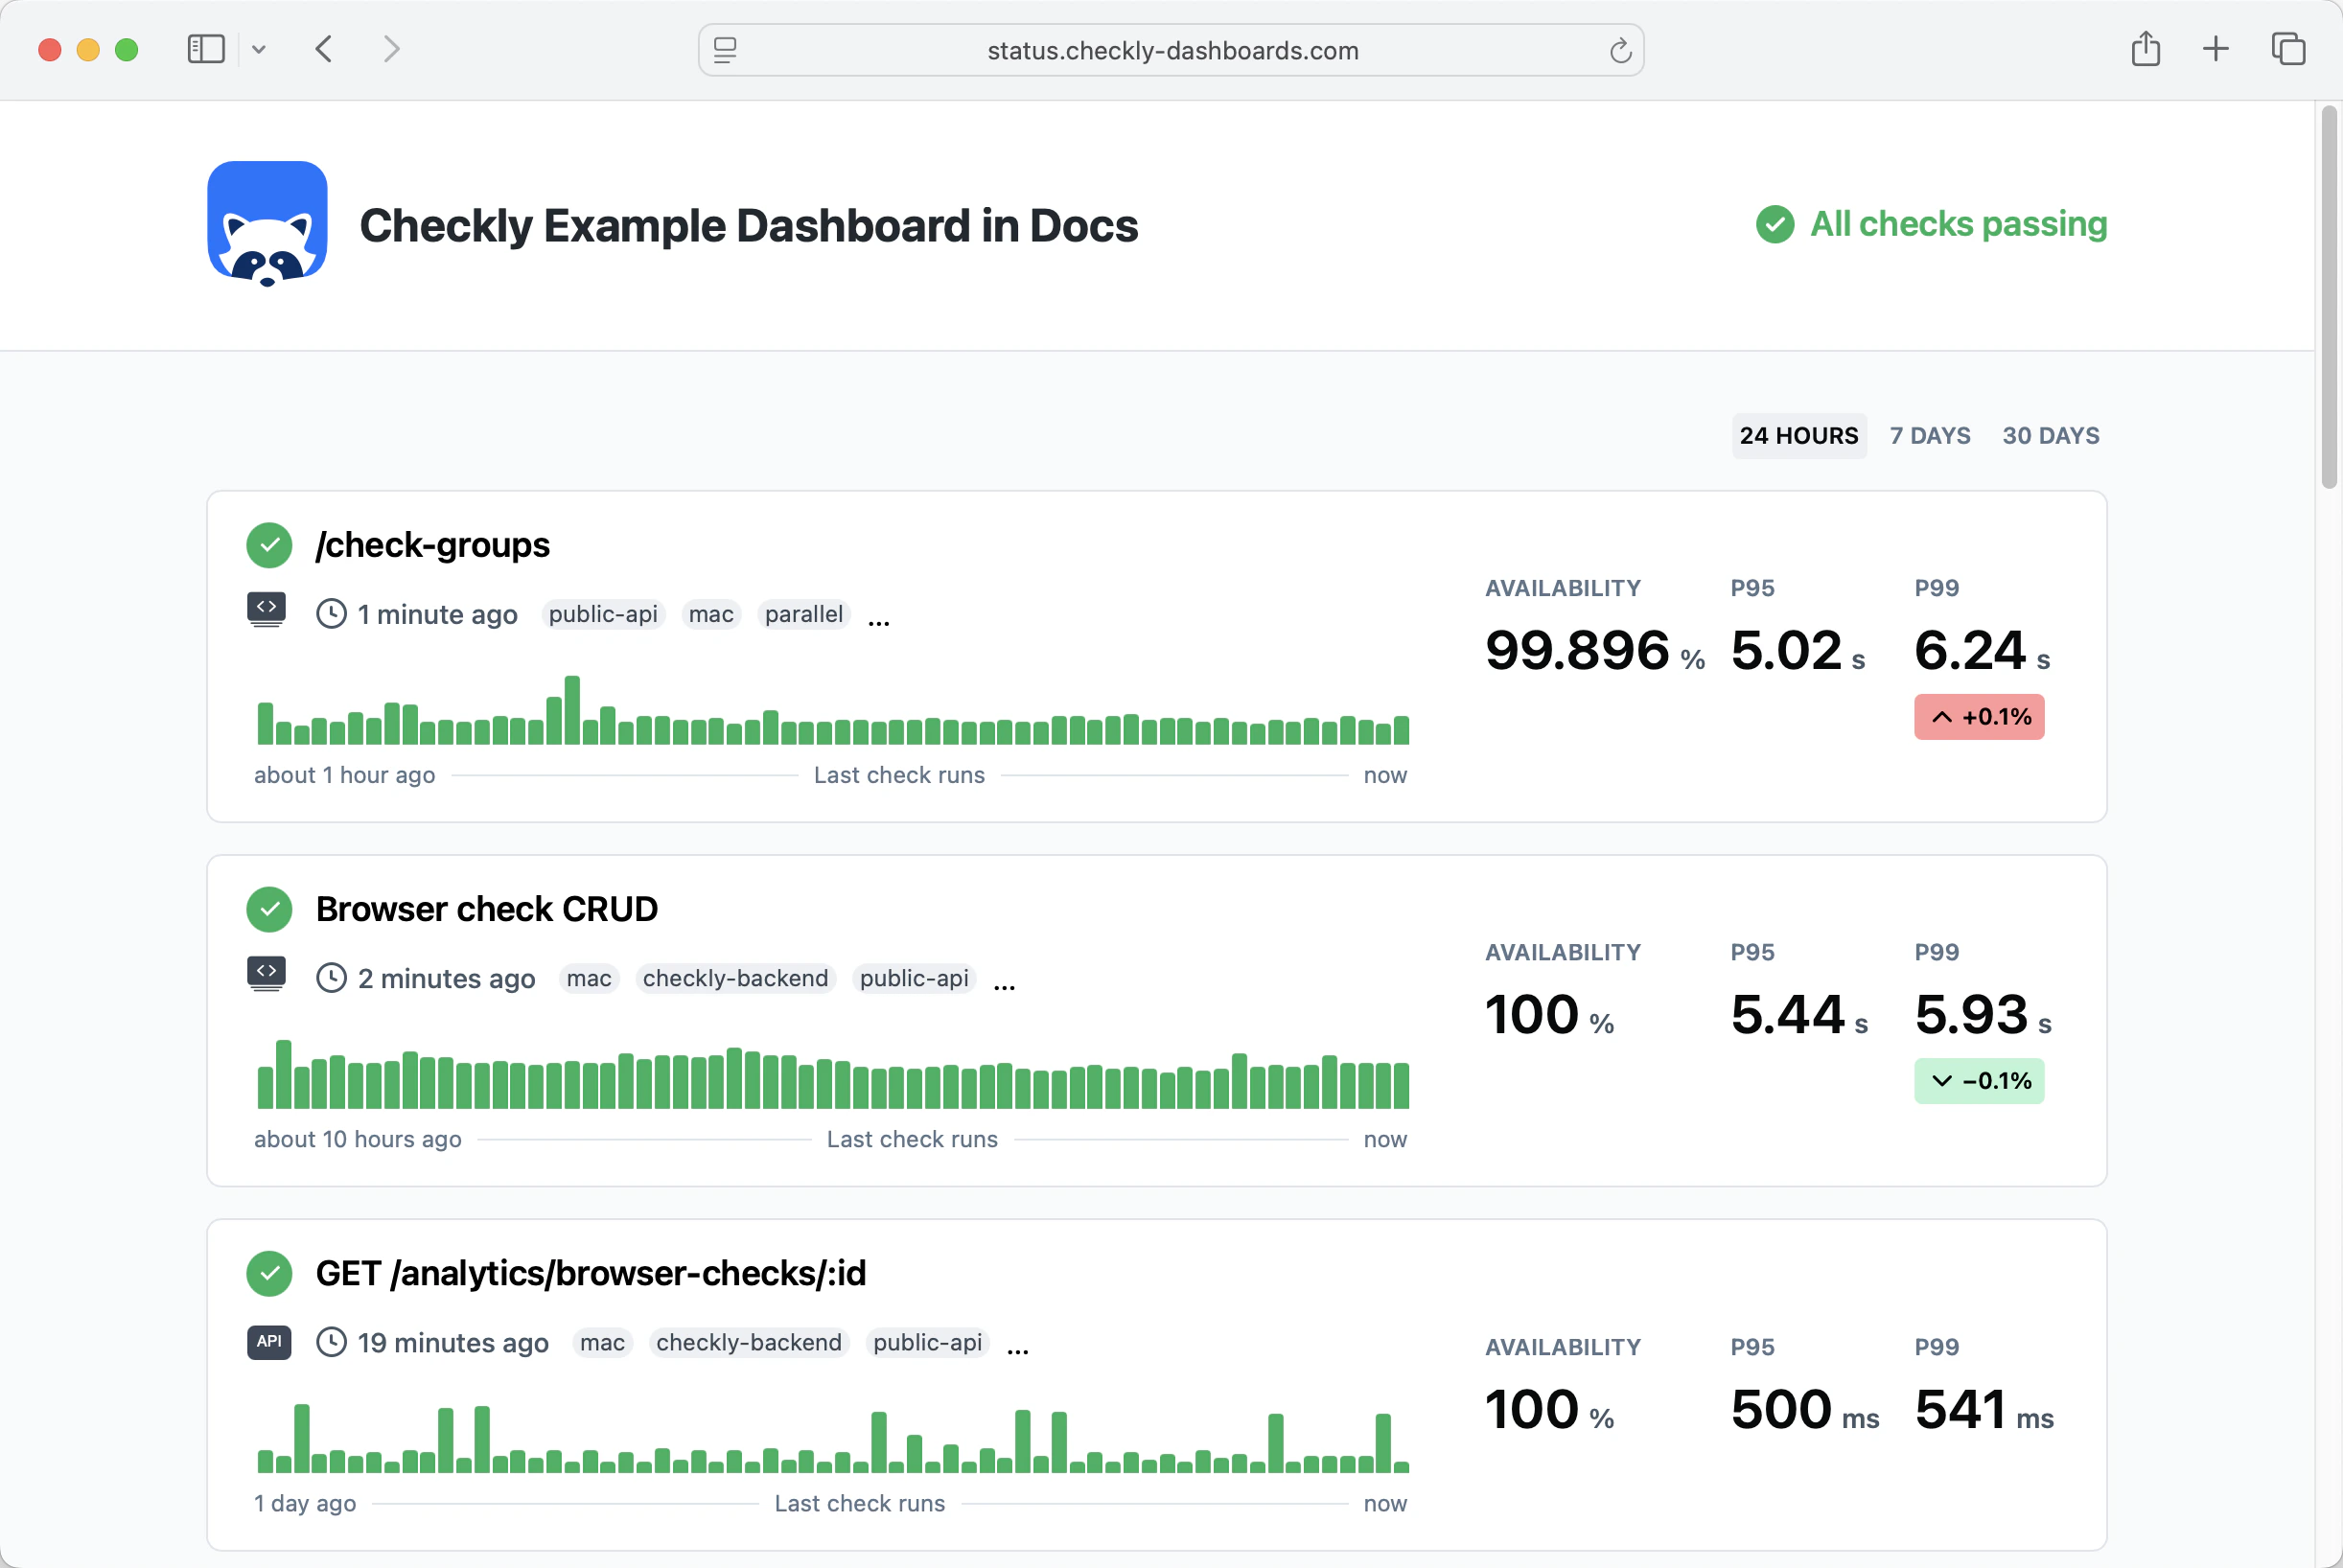
- Show the status of all your checks, or a subset by filtering by
tag. - Show the availability and p95 / p99 response times over the last 24 hours, 7 days and 30 days.
- Communicate custom incident messages and maintenance messages.
Available metrics
Dashboards show the following metrics for each check or monitor:| Metric | Time Period | Description |
|---|---|---|
| Availability | 24h, 7d, 30d | Percentage of successful run results |
| P95 | 24h, 7d, 30d | 95th percentile response time |
| P99 | 24h, 7d, 30d | 99th percentile response time |